

I often hear the same excuse when asking why MARTA ridership is so low: It's too unsafe. So I got to thinking how I might map data so that most normal people might understand, while still keeping it accurate and objective. This is what I came up with.
Crime incident data for 2023 were obtained for the City of Atlanta and cleaned to ensure each record represented a single reported incident with a valid location. MARTA rail station locations were obtained as point data and filtered to include only stations within the City of Atlanta.
All spatial analysis was conducted in ArcGIS Pro.
MARTA rail stations were filtered to include Atlanta-served stations only, excluding stations outside city jurisdiction.
Stations were retained as point features for buffer generation.
Two buffer distances were tested:
¼ mile buffer (approximate 5-minute walk)
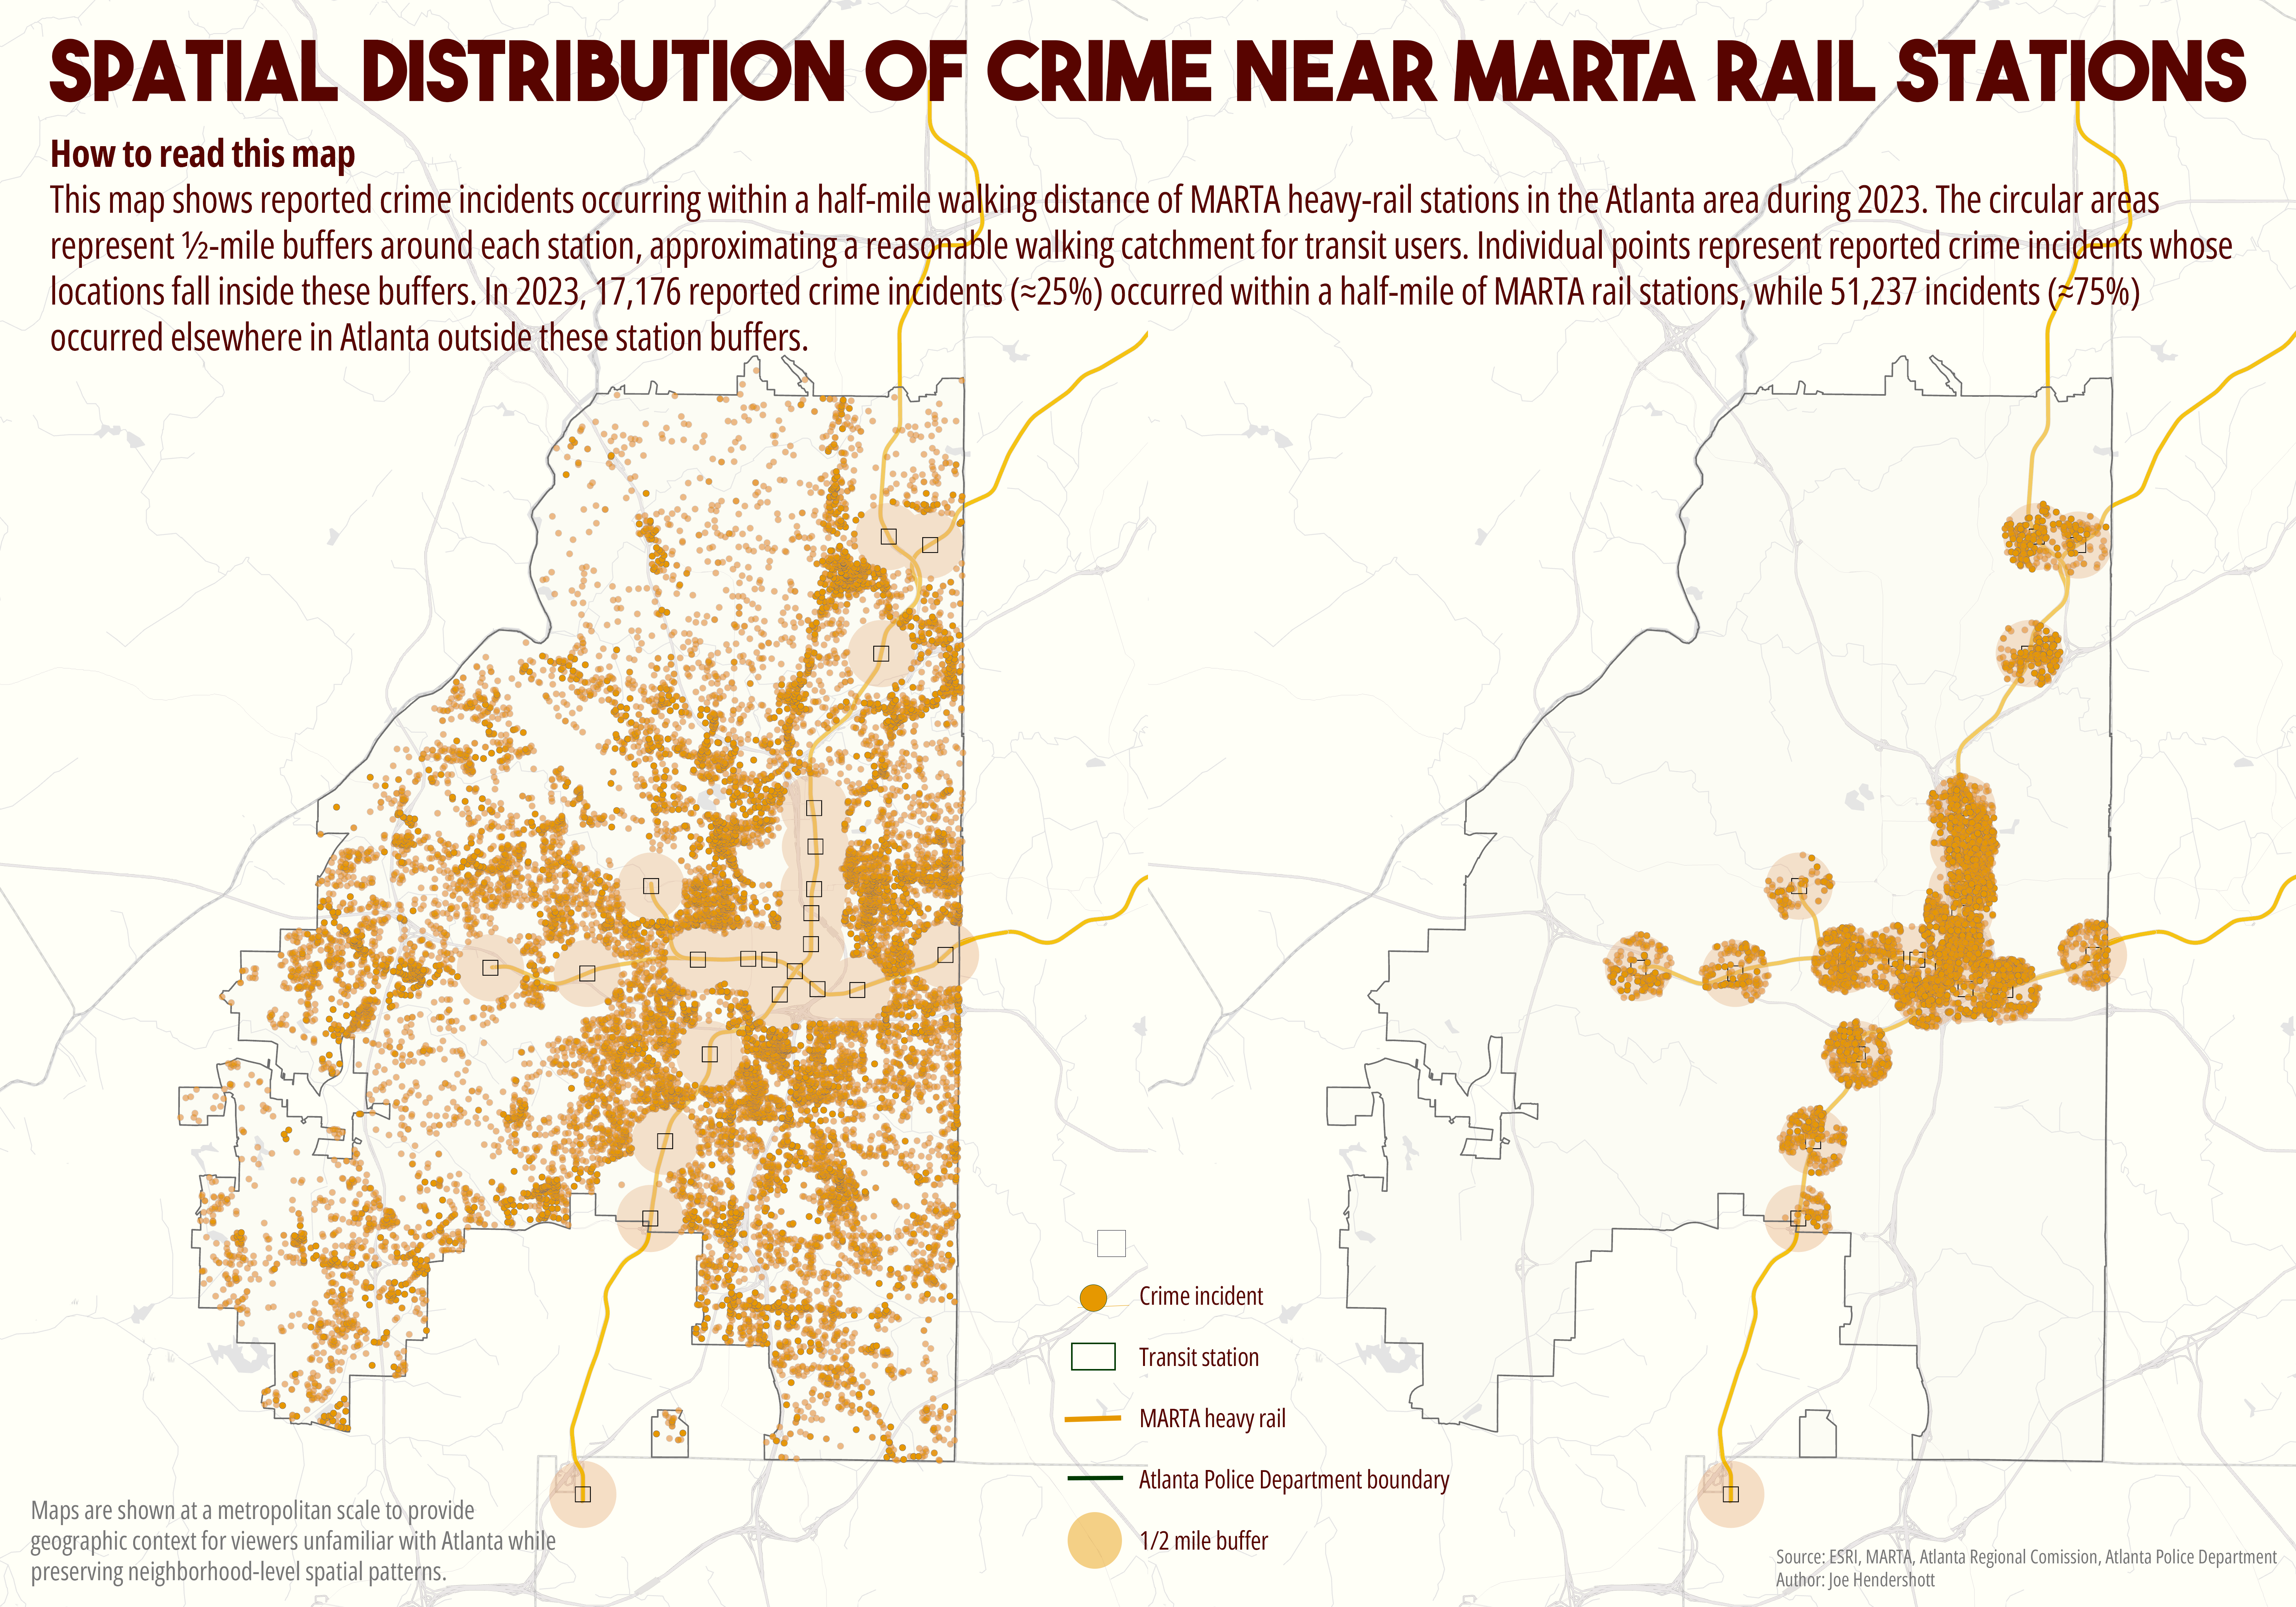
½ mile buffer (approximate extended walking catchment)
Buffers were generated using:
Buffer (Analysis Tools)
Dissolve type: None (initially)
To prevent double-counting crime incidents near stations with overlapping service areas (especially downtown), buffers were:
Dissolved into a single multipart polygon. This created one unified “MARTA influence area” per buffer distance Atlanta-wide crime incidents were split into two mutually exclusive groups:
A. Crime Inside MARTA Buffer
Clip tool was used to extract crime incidents that fall within the dissolved MARTA buffer with the result of a point layer representing crimes near rail stations
B. Crime Outside MARTA Buffer
Erase tool was used to remove buffered areas from the Atlanta crime layer
Result: point layer representing crimes elsewhere in the city.
Together, these two layers account for all reported crime incidents in Atlanta, without overlap.
Incident totals were obtained directly from the attribute tables:
Each row represents one reported incident
Counts were verified after spatial operations
For map presentation:
Crime points were symbolized with small, semi-transparent markers while
buffers were shown with muted fill colors and low opacity. Basemap contrast was reduced to emphasize spatial patterns rather than individual streets.
This analysis examined the spatial relationship between reported crime incidents in Atlanta and proximity to MARTA rail stations. By dividing crime incidents into those occurring within walking distance of rail stations and those occurring elsewhere in the city, I believe the analysis provides a clear, geography-based comparison without assuming causality.
Geography Joe December 20 2025Cartography, Analysis
Spatial Distribution of Crime Near MARTA Rail Staions
Comments
No comments yet.