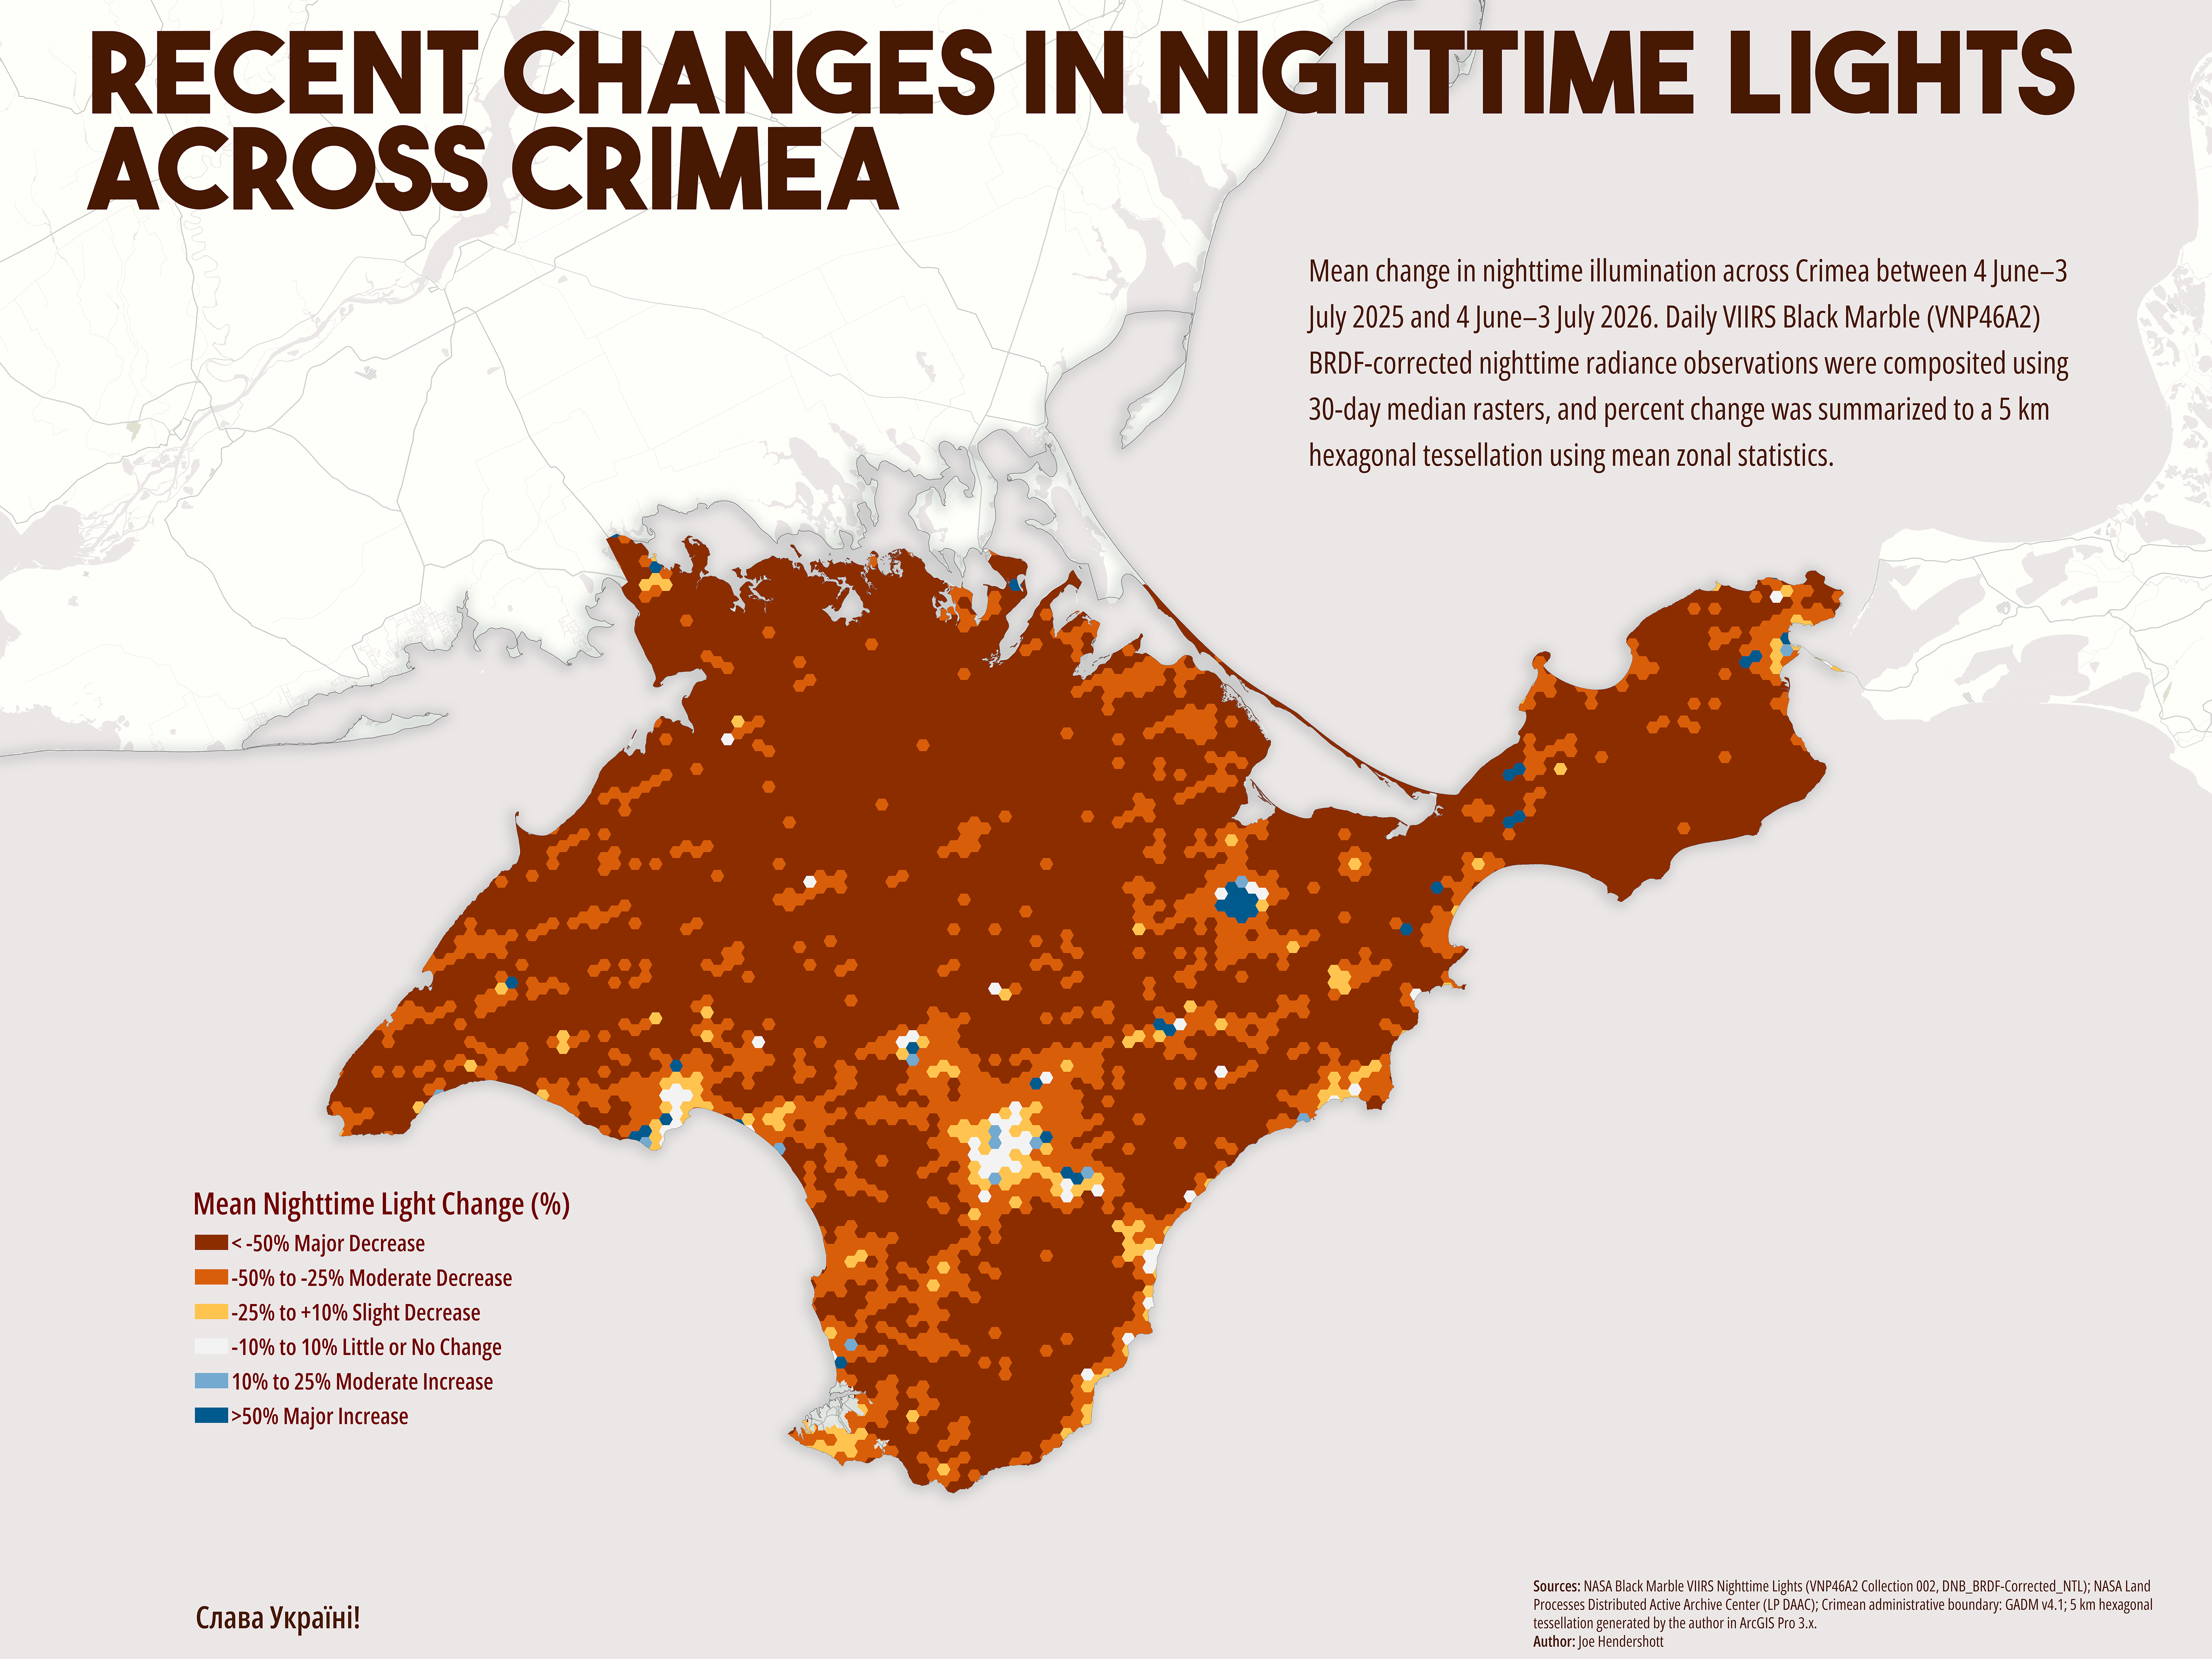
Recent disruptions of the gas and oil distribution by Ukraine have severely impacted life in Crimea. Over the past few days, I've been revisiting one of my earlier Ukraine GIS projects using a new workflow based on NASA Black Marble VIIRS nighttime radiance data. Instead of looking at changes by administrative boundaries alone, I wanted to see whether a hexagonal tessellation could better reveal localized patterns of change in Crimea.
The analysis compares a recent 30-day period (June–July 2026) with the same period one year earlier. Daily VIIRS observations were combined into 30-day median composites to reduce the influence of clouds and other short-term effects before calculating year-over-year change. The results were then summarized to a 5 km hexagonal grid using zonal statistics, producing a cleaner and more interpretable view of regional patterns than a pixel-by-pixel map, and the results are impressive.
The goal is not to determine why changes occurred from satellite imagery alone. Nighttime radiance can reflect many factors, including changes in electricity availability, population activity, tourism, industrial operations, or other disruptions. Instead, this type of analysis provides a spatial indicator that can be compared with other information to better understand how activity changes over time. The data would seem to back up the reports of power outages and the exodus of residents and tourists from the peninsula.
One of the things I enjoy most about GIS is that improving the workflow often improves the science. Rebuilding this analysis from the raw satellite data forced me to rethink several steps from my earlier work, and the resulting process is now much more reproducible. It also means the same workflow can be repeated as new VIIRS imagery becomes available, allowing future comparisons without starting from scratch.
Recent Changes in Nighttime Lights Across Crimea
Comments

Leave a Comment
Commenting is not available in this channel entry.

Hello, I am Joe Hendershott, a geographer and cartographer based in Atlanta, Georgia.
Popular Posts

Explore Topics
No comments yet.