

After completing the civilian vulnerability poster I decided to attempt combining the five factors into a single composite index of vulnerability.
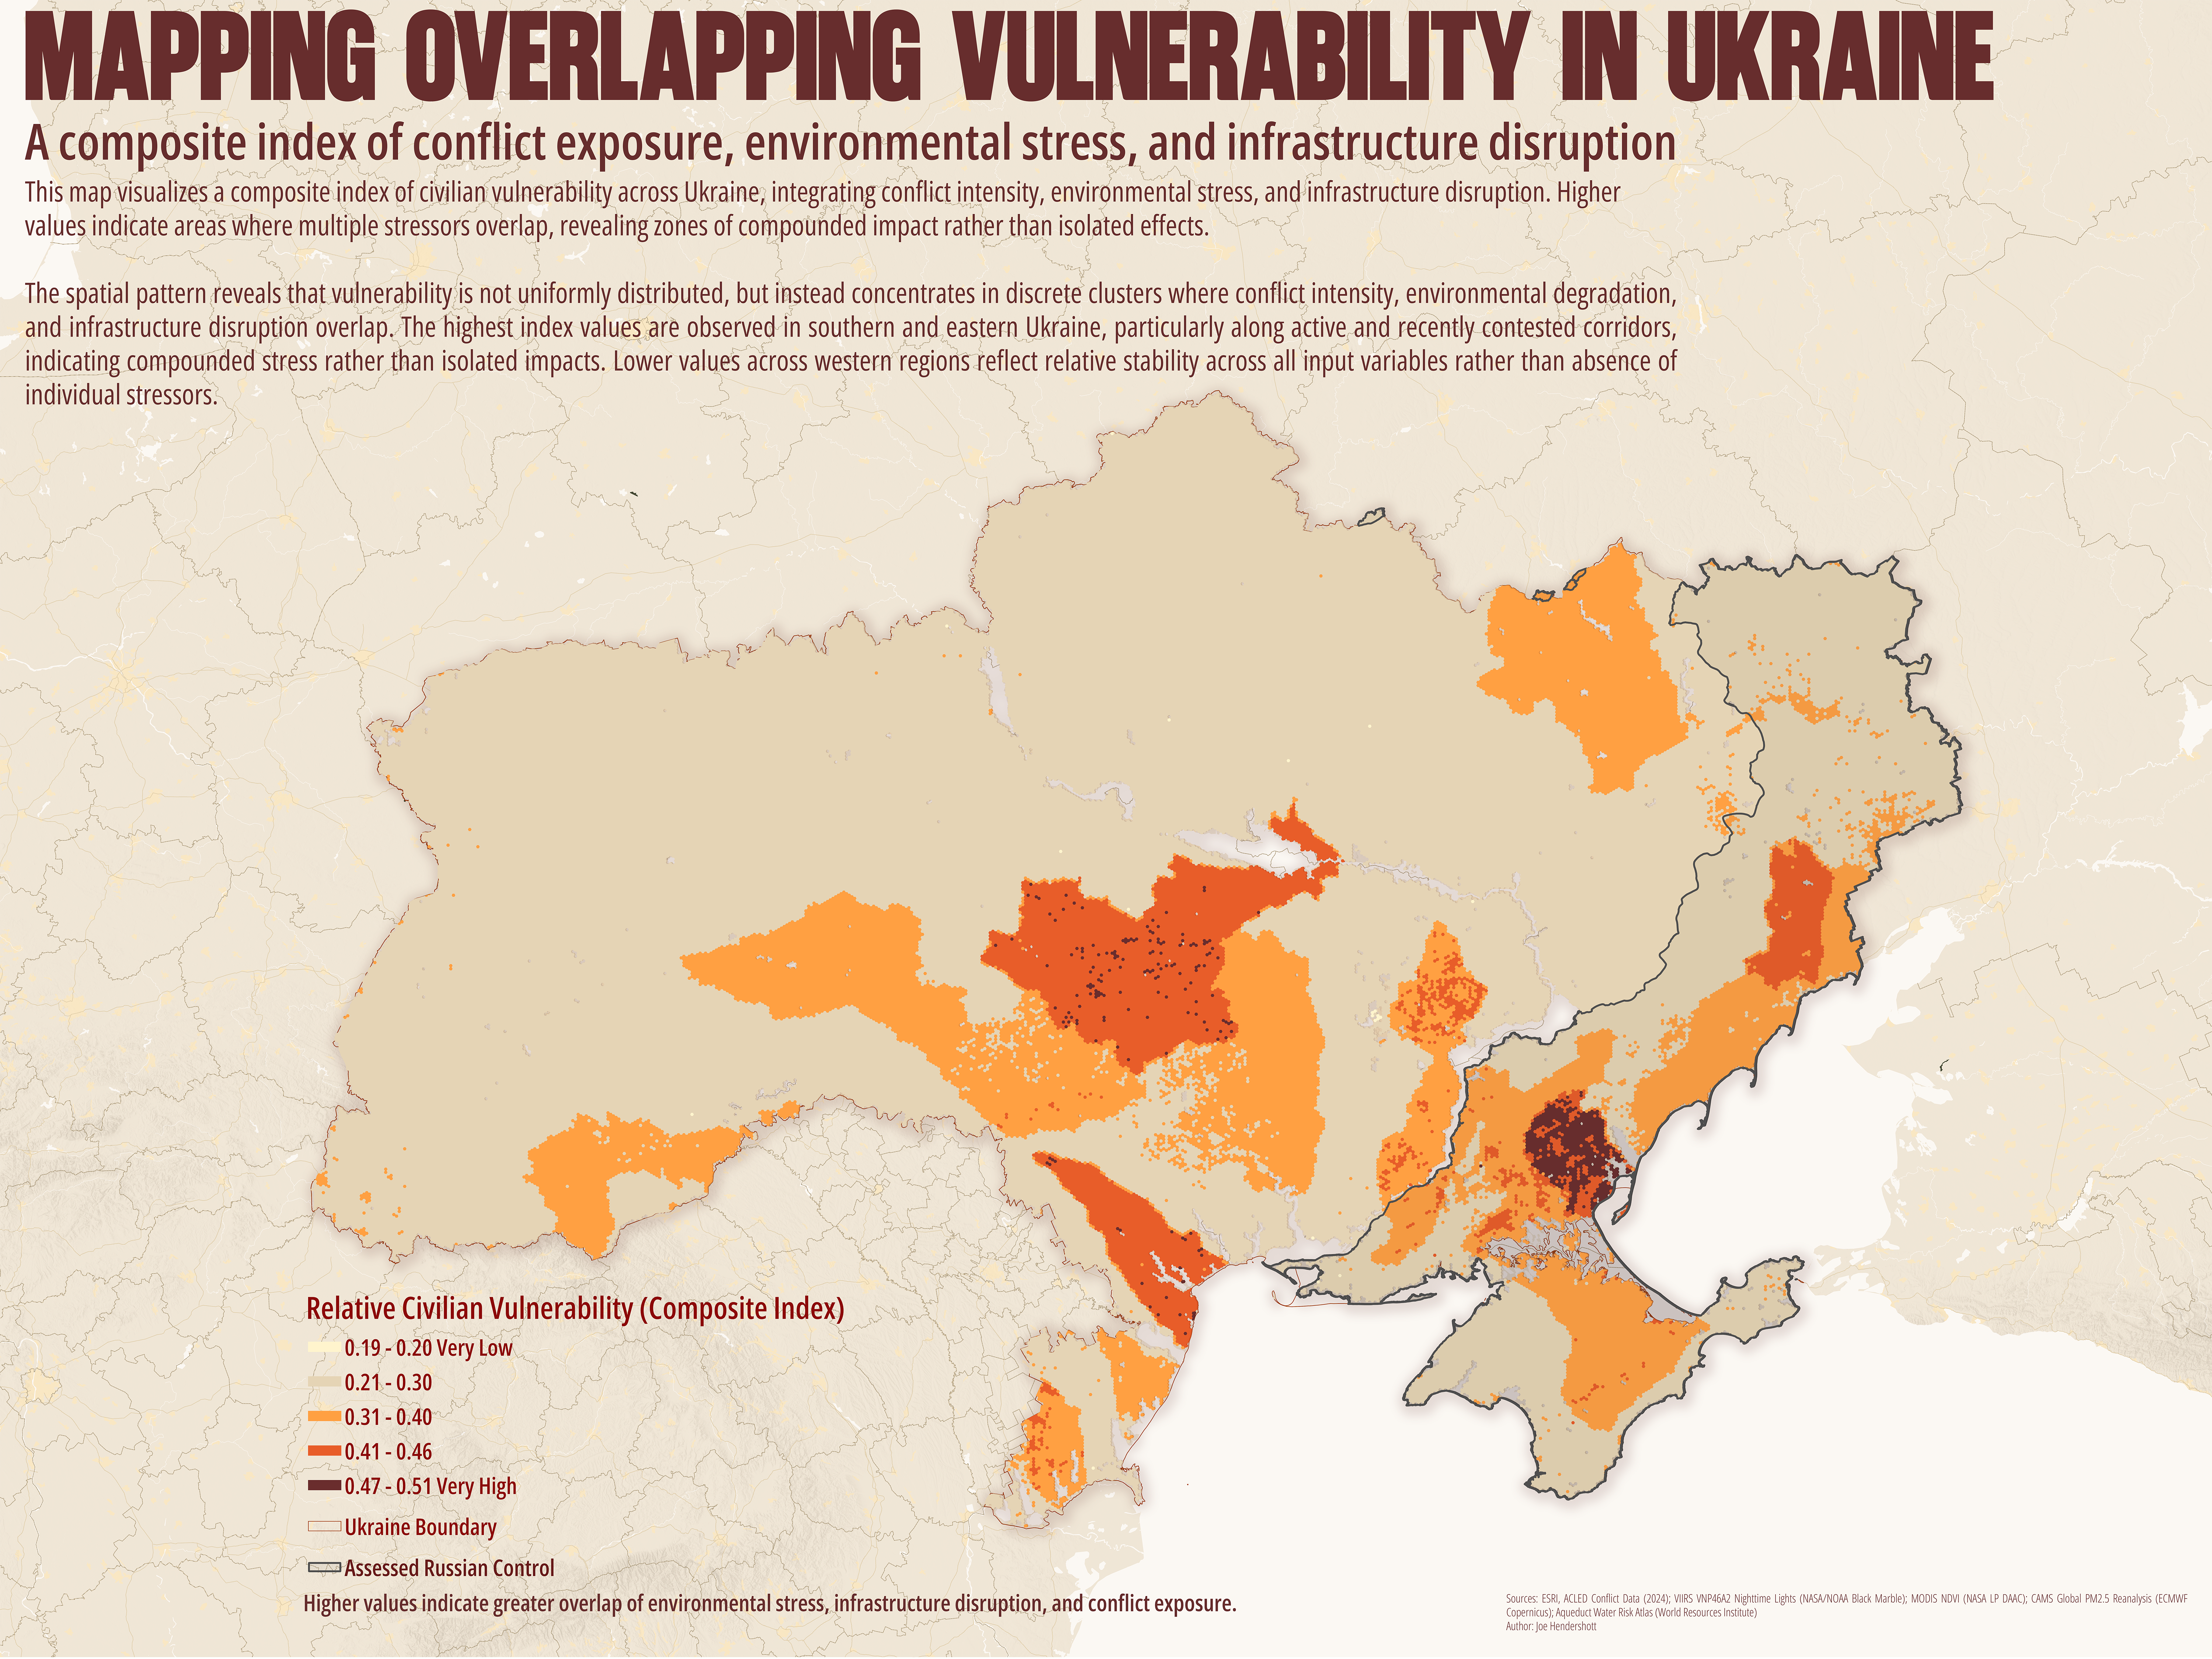
This map presents civilian vulnerability in Ukraine using a composite geospatial index that combines multiple layers of crisis exposure. Indicators include conflict intensity (ACLED events), infrastructure disruption (VIIRS nighttime lights), environmental stress (NDVI change and PM2.5 concentrations), and water risk (AquaDuct). Each dataset was normalized and aggregated to a 5 km hexagonal tessellation to create a consistent spatial framework for comparison. To preserve continuous spatial coverage, null values in select datasets were recoded to zero, representing absence of observed impact rather than missing data.
The resulting map reveals that vulnerability is not evenly distributed but instead concentrated in distinct geographic clusters, particularly in eastern and southern Ukraine, where conflict activity, environmental degradation, and infrastructure disruption intersect. Rather than highlighting any single factor, the composite index captures the cumulative burden experienced by civilian populations. This approach emphasizes the importance of overlapping stressors in shaping humanitarian risk and provides a spatial tool for understanding where compounded vulnerabilities are most acute.
Geography Joe April 10 2026Cartography, Analysis
Mapping Overlapping Vulnerability in Ukraine
Comments
No comments yet.