

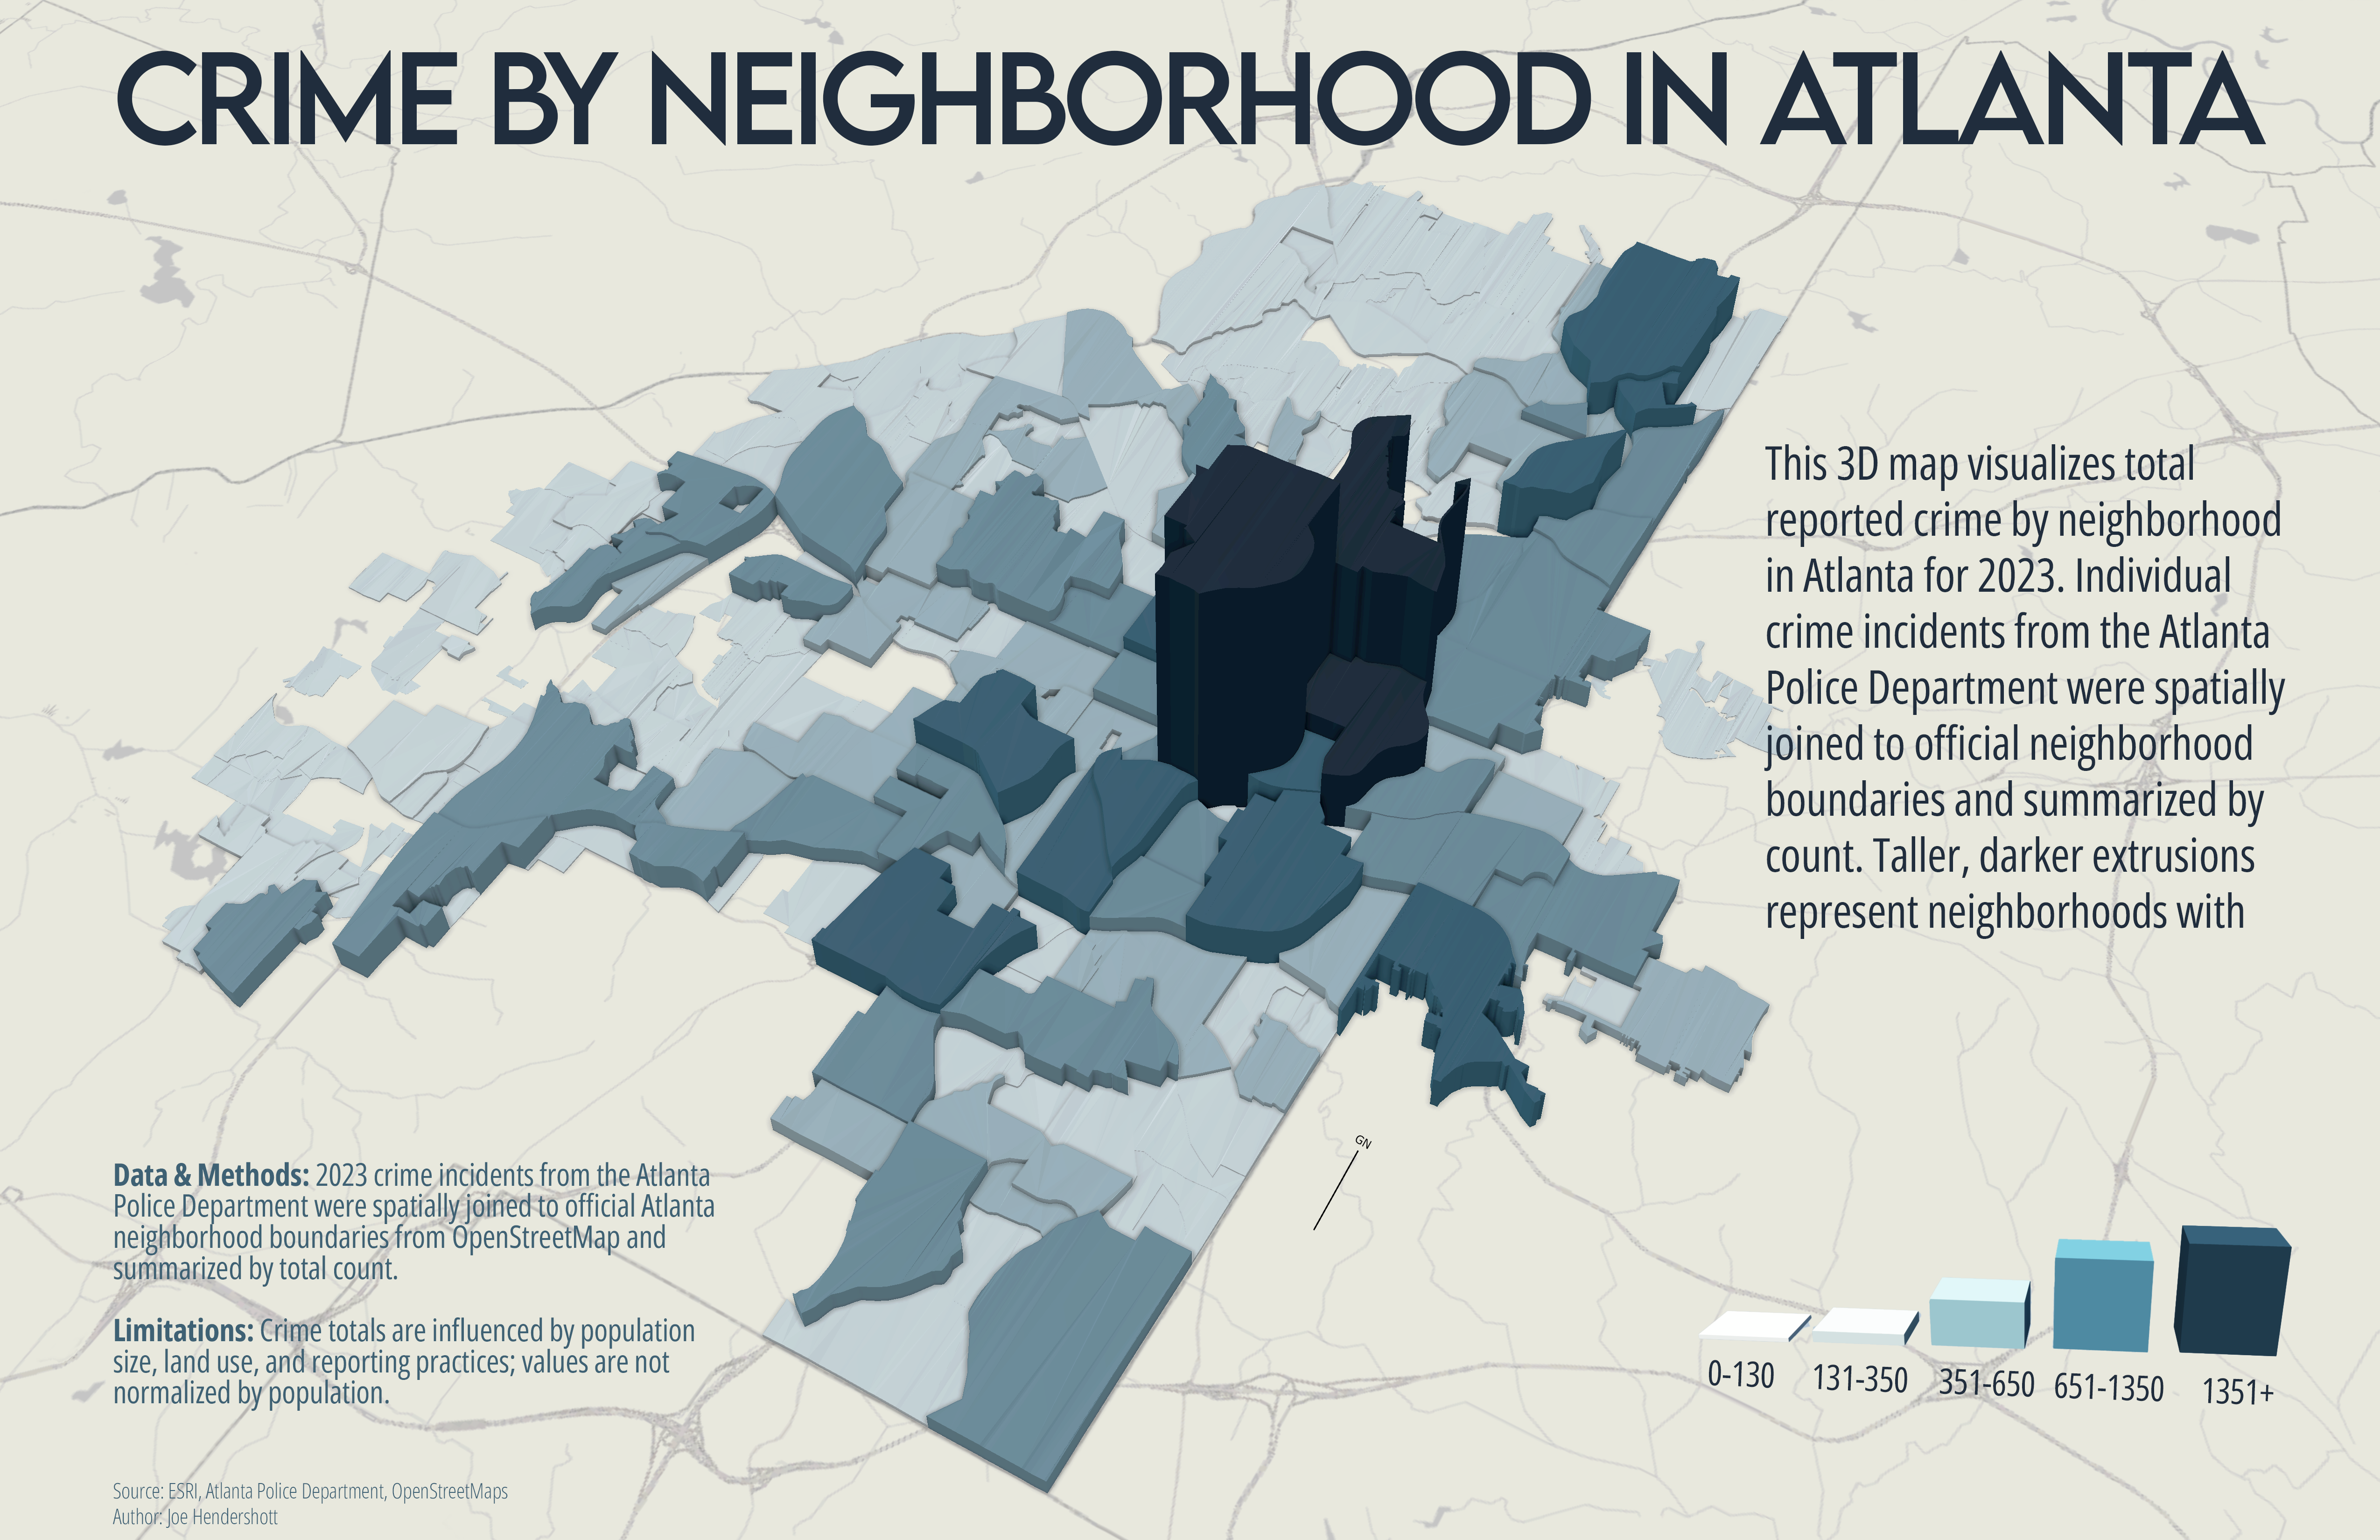
This map explores the spatial distribution of reported crime across Atlanta neighborhoods during 2023. Crime incident data were obtained from the Atlanta Police Department and include all reported offenses for the calendar year. To understand how crime varies across the city at a neighborhood scale, individual incidents were aggregated using officially recognized neighborhood boundaries derived from OpenStreetMap.
Each neighborhood is represented as a three-dimensional extrusion, where both height and color indicate the total number of reported crimes. Taller and darker blocks correspond to higher crime totals, while shorter and lighter blocks indicate lower totals. Using 3D extrusions allows relative differences between neighborhoods to be read quickly, while still preserving the underlying geographic context of the city.
The map is intended to support visual comparison rather than precise measurement. Differences in neighborhood size, land use, population, and reporting practices all influence crime totals and should be considered when interpreting the results. High values do not necessarily imply higher risk for individuals, but instead reflect the concentration of reported incidents within a given neighborhood boundary.
This visualization is best read as a citywide overview that highlights spatial patterns and contrasts, rather than a definitive ranking of neighborhood safety.
Geography Joe December 22 2025Cartography, Analysis, Crime
Neighborhood Crime in Atlanta
Comments
No comments yet.