

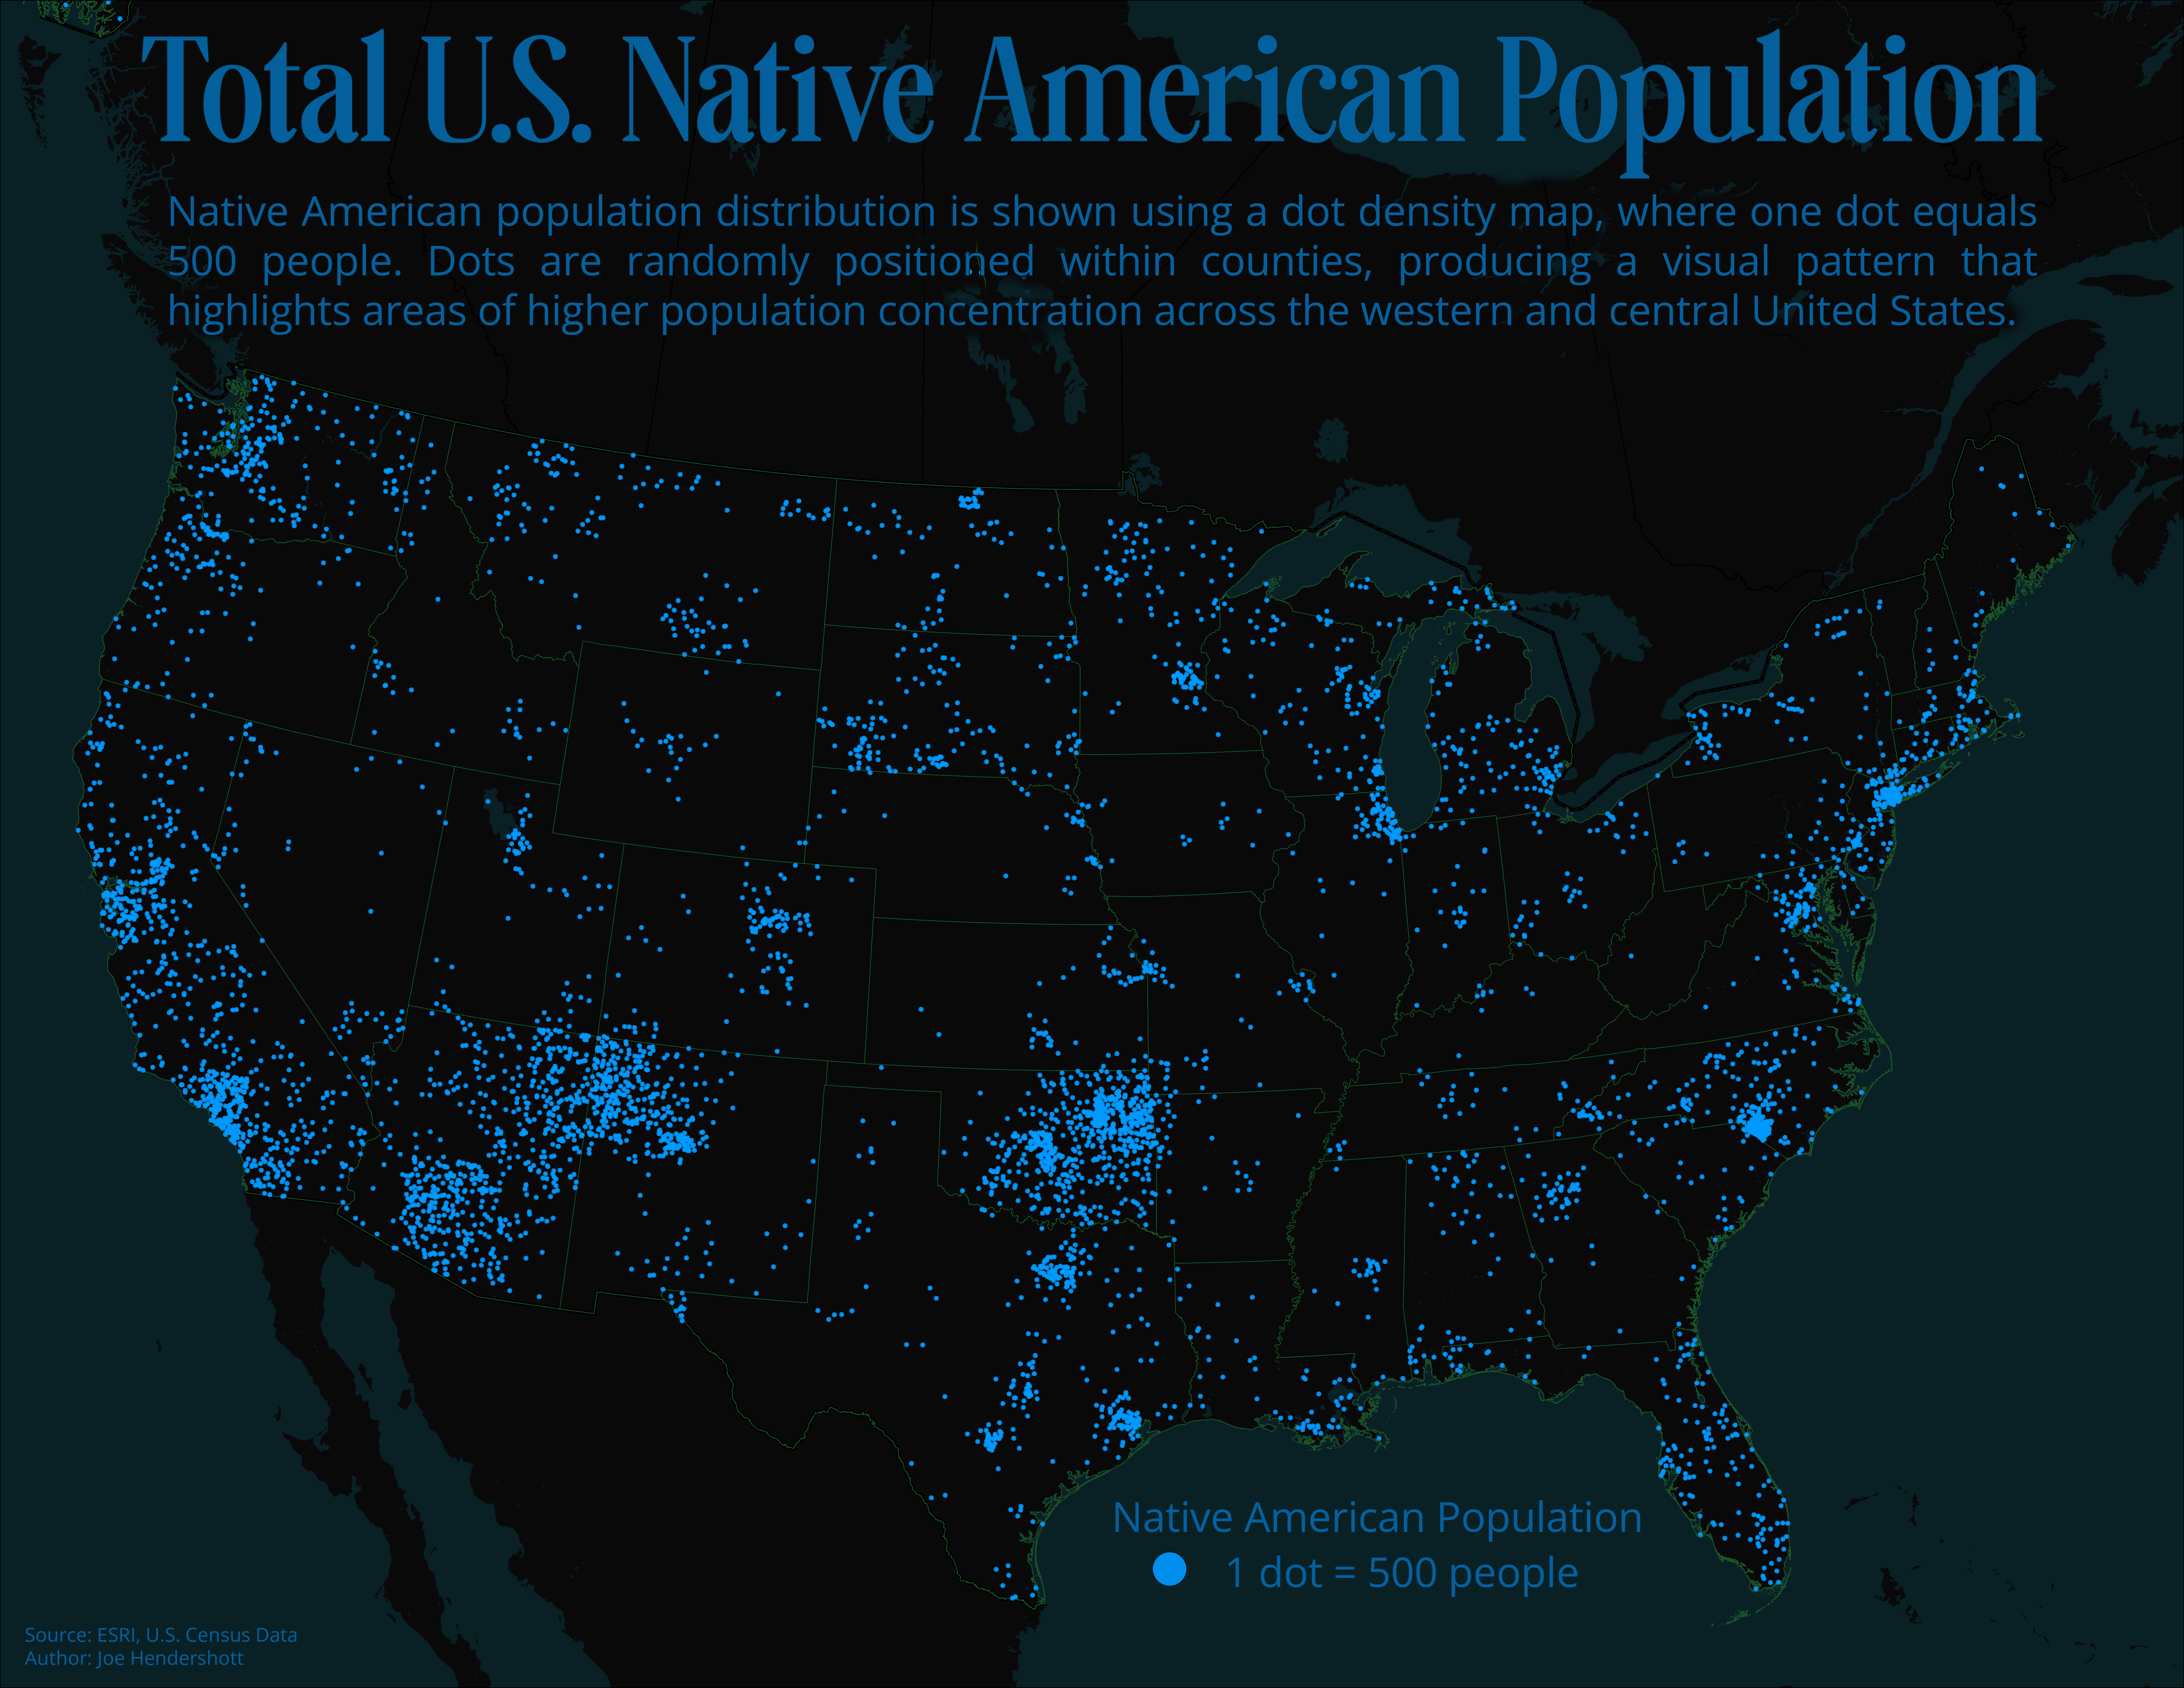
This map uses a dot density approach to show the distribution of the Native American population across the United States. Each dot represents 500 people and is randomly placed within county boundaries, so areas with more dots indicate higher populations rather than exact residential locations. By using dots instead of shading, the map emphasizes patterns of concentration and spread without relying on administrative averages that can hide local variation. The dark background helps the bright dots stand out, making population clusters easier to see at a national scale.
The map reveals that Native American populations are not evenly distributed across the country, but instead form distinct regional clusters. The highest concentrations appear in the Southwest, particularly in Arizona and New Mexico, as well as in parts of the Great Plains, Oklahoma, the Pacific Northwest, and Alaska. Smaller but still visible populations are spread throughout the Midwest, Southeast, and Northeast, reflecting both historic homelands and more recent migration patterns. Together, these patterns highlight the enduring geographic presence of Native American communities across the United States, while also showing how historical displacement, reservations, and urban migration have shaped today’s population landscape.
Comments
No comments yet.