

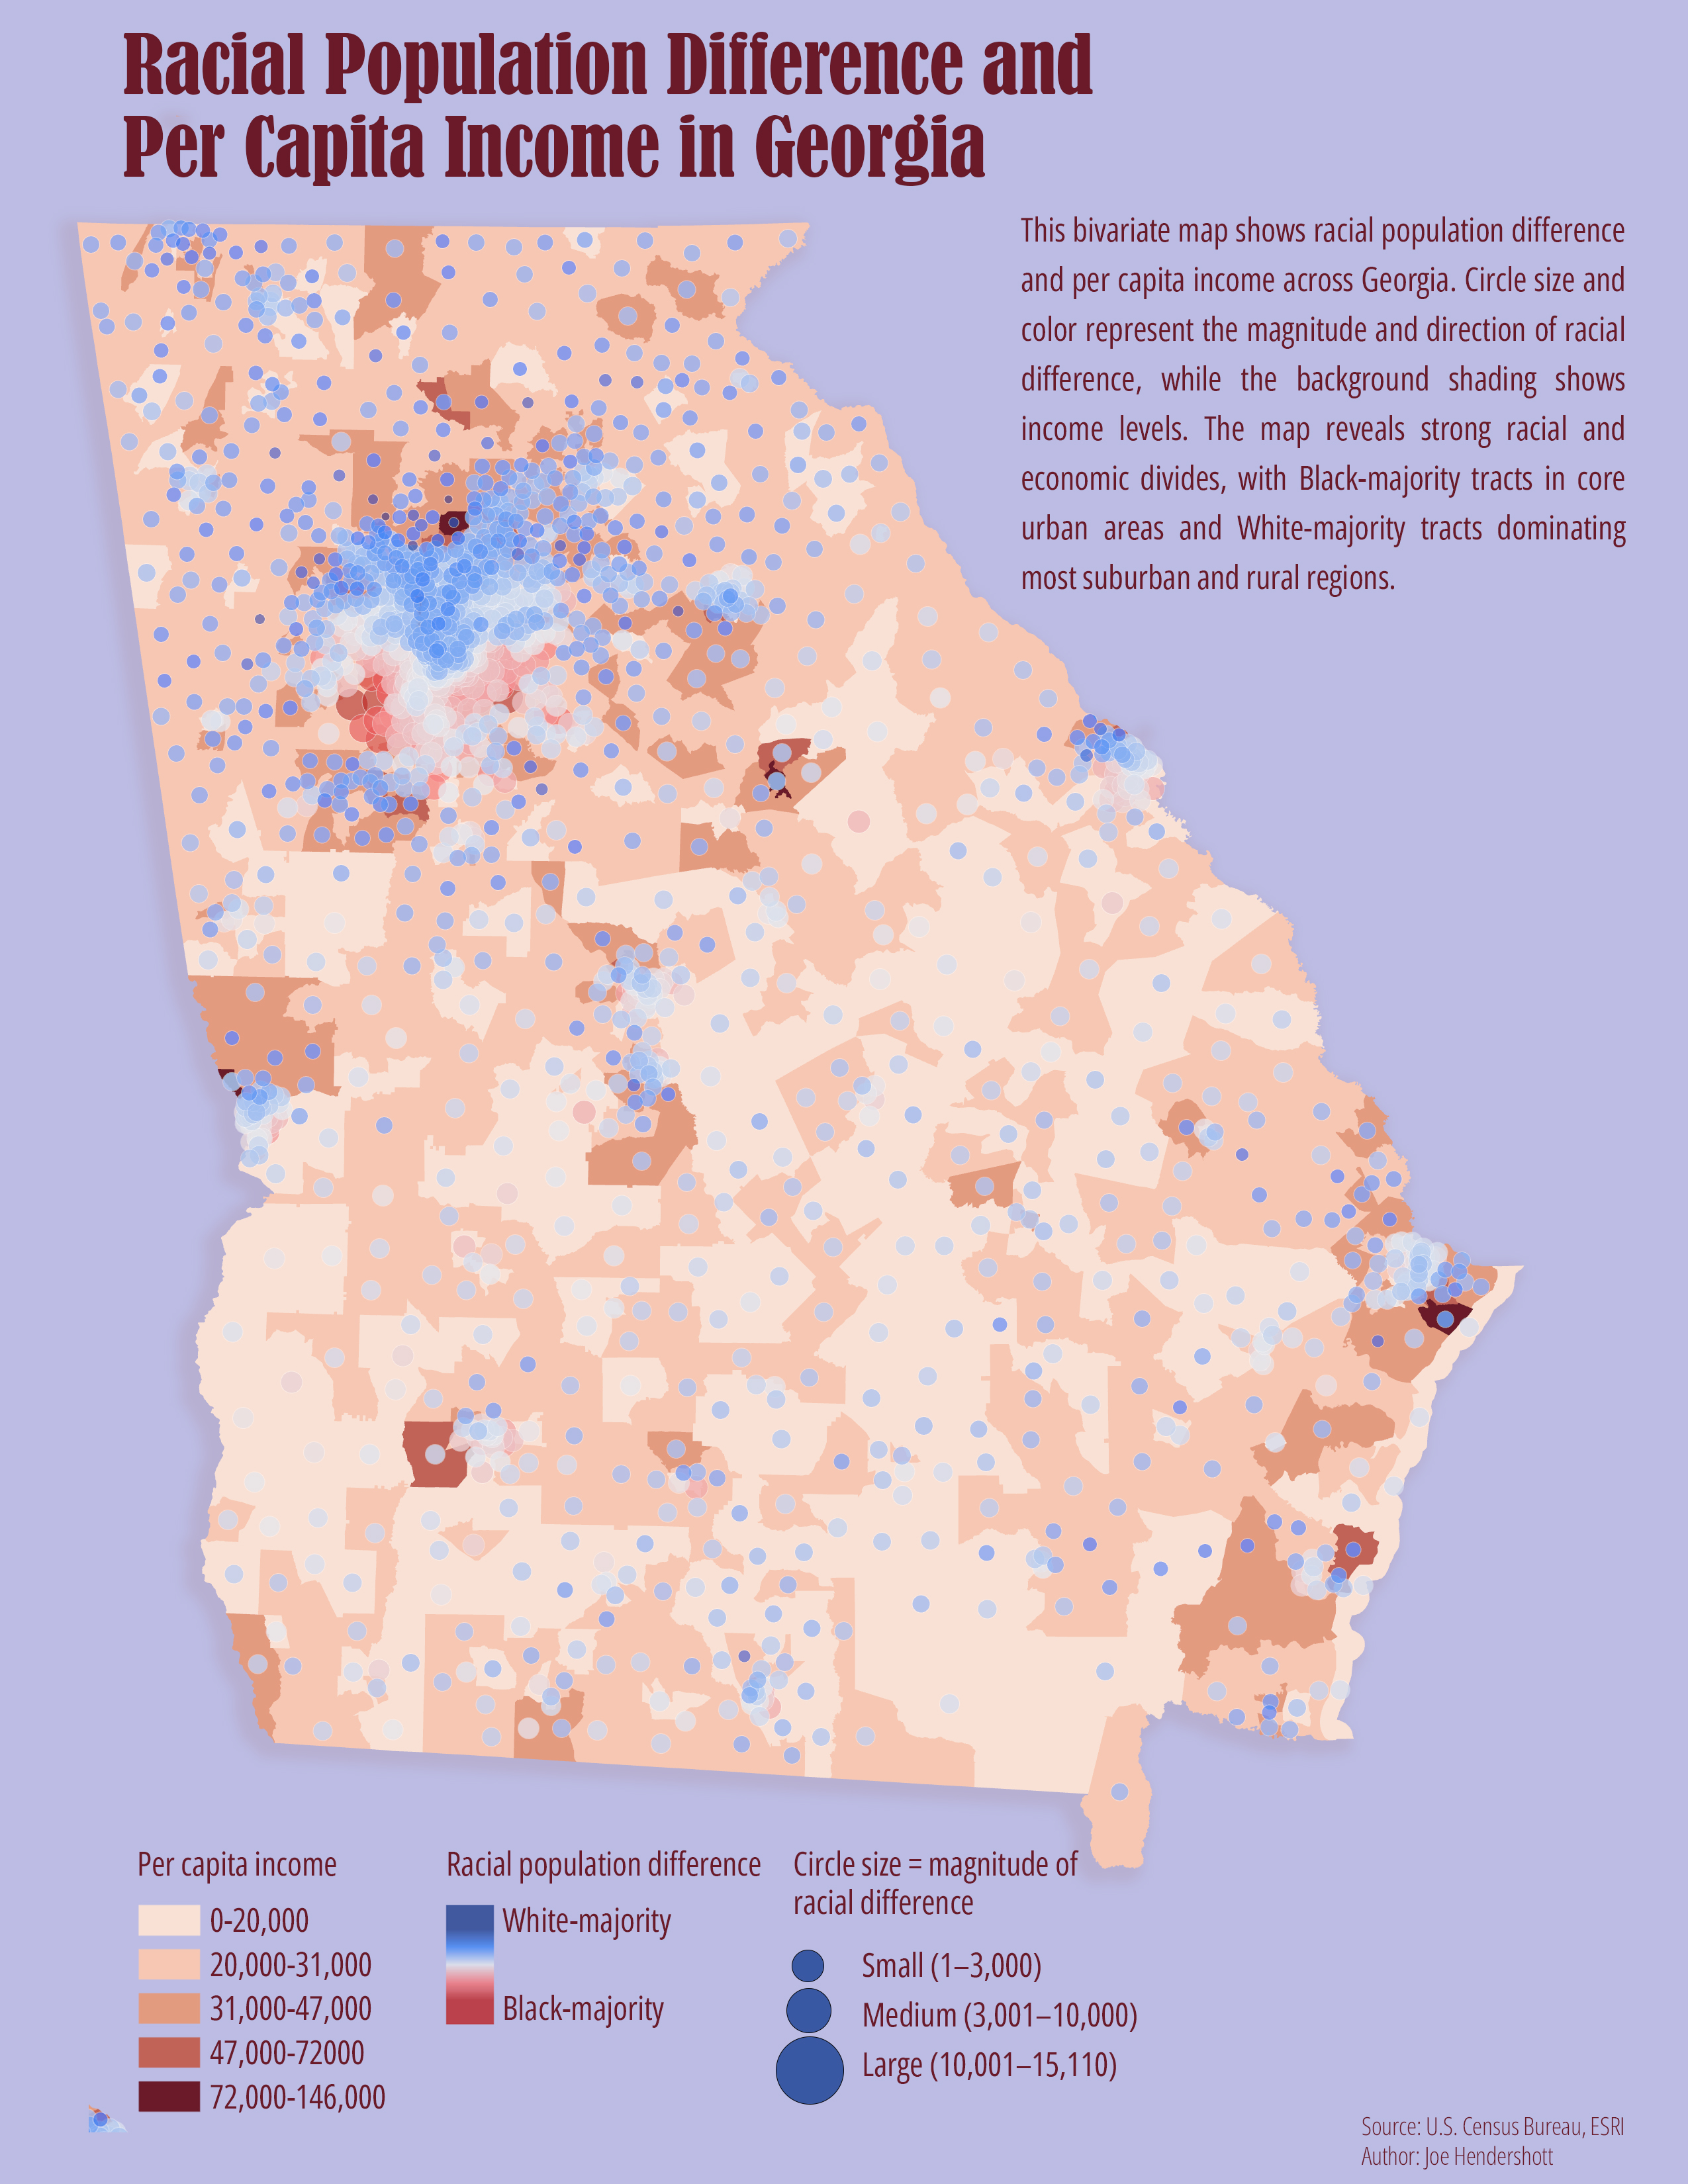
This map combines two different kinds of information to show how race and income vary across Georgia. The background shading represents per capita income by census tract, with darker colors indicating higher income levels. On top of this, circles show racial population differences within each tract. Blue circles indicate areas where White residents make up the majority, while red circles indicate Black-majority areas. The size of each circle reflects how large that population difference is, with larger circles showing places where one group significantly outnumbers the other. Using this layered approach allows the map to show not just where people live, but how racial composition and income patterns intersect across the state.
The map reveals clear and persistent racial and economic divides across Georgia. Black-majority tracts are heavily concentrated in the urban core of Atlanta and in parts of southern and coastal Georgia, while White-majority tracts dominate most suburban and rural areas. Higher-income areas tend to cluster in suburban regions and around select metropolitan corridors, while many Black-majority tracts coincide with lower income levels. Together, these patterns highlight how race and income are closely linked in Georgia’s geography, reflecting long-standing histories of segregation, disinvestment, and unequal access to economic opportunity that continue to shape where people live today.
Comments
No comments yet.