

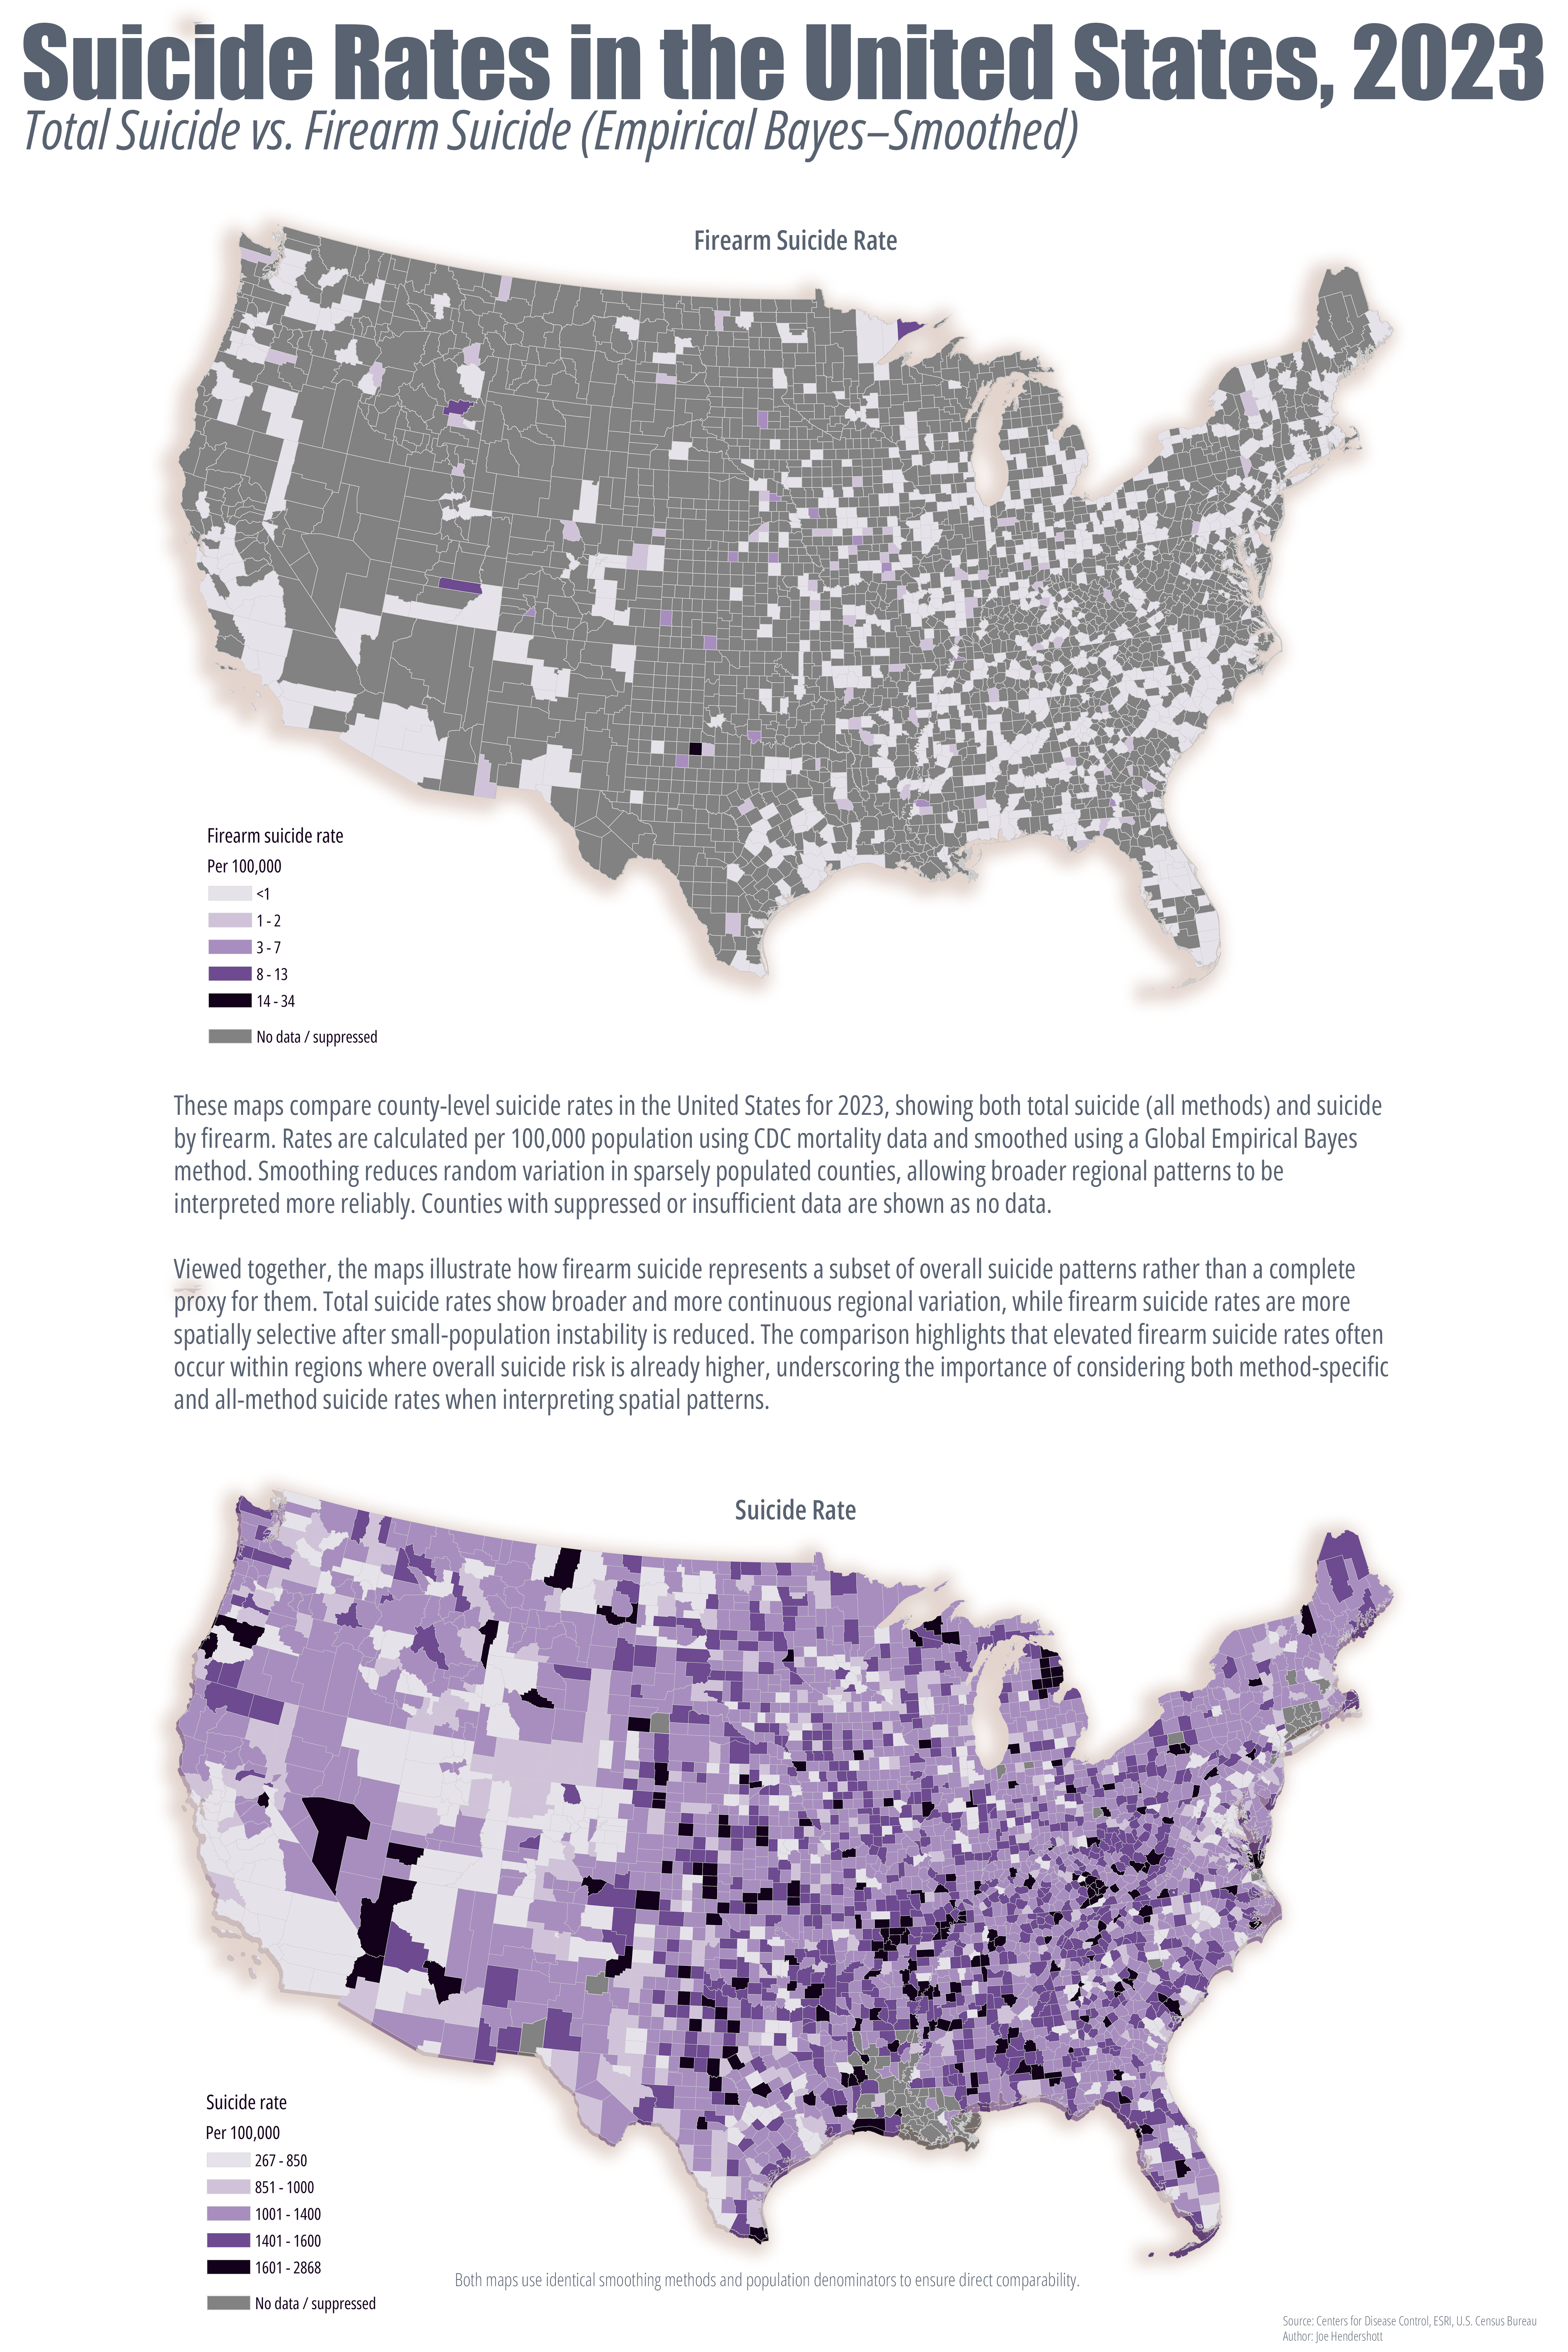
These maps present a county-level comparison of total suicide rates (all methods) and suicide by firearm in the United States using 2023 mortality data from the Centers for Disease Control and Prevention (CDC) and population estimates from the U.S. Census. Rates are calculated per 100,000 population to allow meaningful comparison across counties with widely varying population sizes. To reduce random variation associated with small populations and low event counts, both maps use a Global Empirical Bayes smoothing approach, which stabilizes rate estimates while preserving broader regional patterns. Counties with suppressed or unreliable CDC data are shown as no data and were excluded from calculations to avoid misrepresentation.
Viewed together, the maps highlight important differences between overall suicide risk and method-specific patterns. Total suicide rates show broader and more continuous regional variation, reflecting underlying social, economic, and environmental factors that influence suicide risk across large areas. In contrast, firearm suicide rates represent a subset of this broader pattern and become more spatially selective once small-population instability is reduced. The comparison demonstrates that firearm suicide rates often align with regions of elevated overall suicide risk, but do not fully replicate the total suicide geography, underscoring the importance of examining both all-method and method-specific data when interpreting spatial patterns.
As with all small-area mortality mapping, these rates should be interpreted cautiously. Even with statistical smoothing, county-level estimates are best understood as indicators of broader regional trends rather than precise local measurements.
Comments
No comments yet.